Introduction
On March 26, we announced the Block Analitica eBTC Dashboard through a Twitter announcement thread. With this post, we provide a more in-depth explanation of our new dashboard, as well as some practical examples of how it can enhance the user experience and the risk management of the eBTC Protocol.
In addition, some new features have been added since the eBTC Dashboard was announced in March. These are also covered below. Finally, we provide some insights into pending work.
Homepage
When first accessing the Block Analitica eBTC Dashboard, the user is presented with an overview of relevant eBTC protocol metrics. These metrics include:
- Total eBTC Supply: The total amount of eBTC minted by CDP users.
- Total Collateral: The amount of collateral deposited (denominated in stETH and corresponding USD value).
- The Oracle Price: stETH/BTC price and corresponding USD value.
- Intuitive Total Collateral Ratio (TCR) Meter: The TCR meter includes a green section (Normal Mode) and a red section (below the Critical Collateral Ratio).
- Protocol Yield Share (PYS): The amount of stETH yield earned by the eBTC Protocol (denominated in stETH and corresponding USD value).
- Total Collateral Ratio (TCR): The ratio between the value of the total collateral of the system and the total debt emitted by it.
- Historical Data (eBTC Supply, Collateral, TCR, Oracle, and Rewards): Historical chart with the option to toggle between 7d, 30d, 90d, and 1y.
- LIDO Incentive yield APY: The approximate LIDO incentive yield APY based on our analysis. Official figures may vary.
- Open CDPs: Total number of CDPs currently open and the amount of unique wallets with open CDPs.
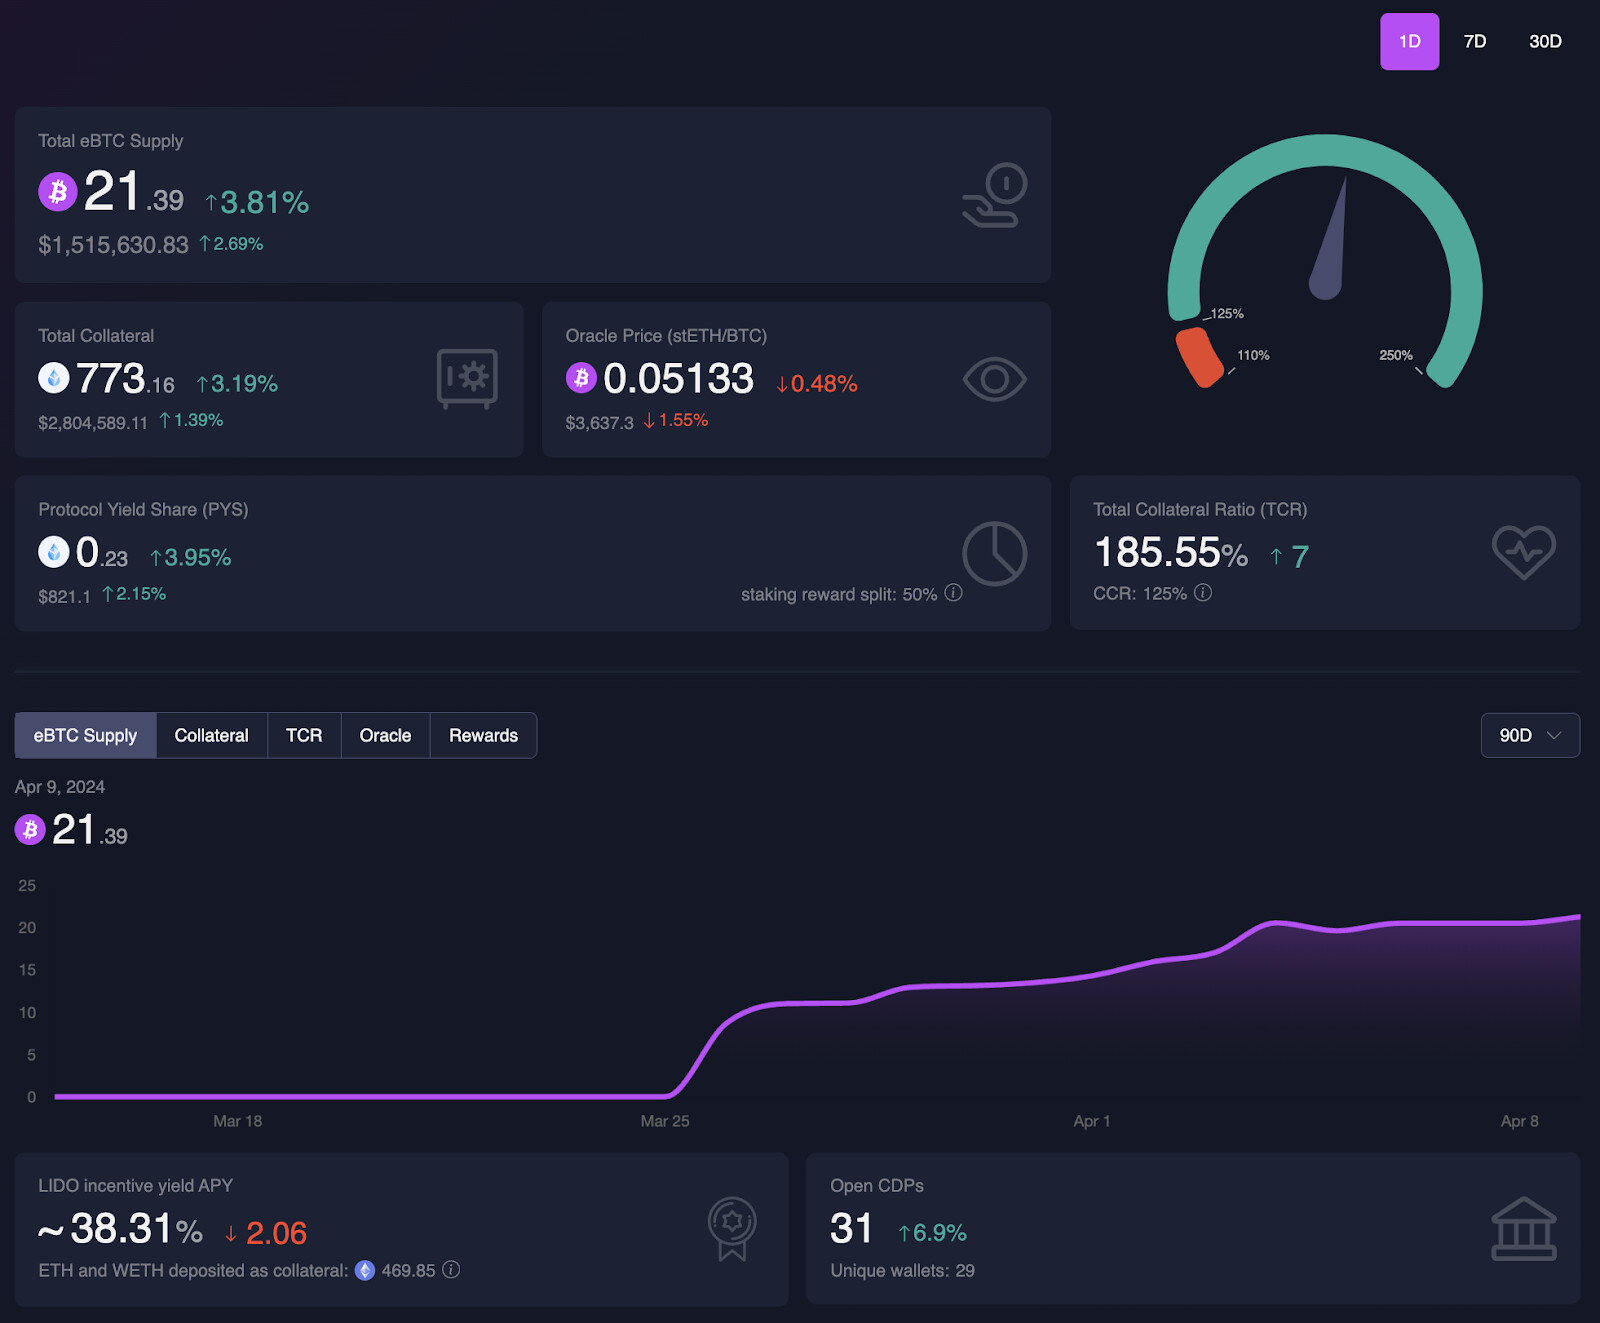
Source: Block Analitica eBTC Dashboard - Homepage
CDP Section
Selecting “CDPs” through the menu on the left side of the website will navigate the user to a table with CDP data. Columns include:
- CDP: CDP number and wallet address.
- Collateral: The amount of collateral for each CDP.
- Debt: The amount of debt for each CDP.
- Individual Collateral Ratios (ICRs): The individual collateral ratios for each CDP.
- Latest Activity: Shows the latest activity of a particular CDP.
The table has the option to toggle between token and USD value. We have also included a toggle option for “Open” and “Closed” CDPs. Finally, in order to review different periods, we have included the option to toggle between 1d, 7d, and 30d timeframes.

Source: Block Analitica eBTC Dashboard - CDP Section
Clicking on a particular CDP row will navigate the user to a page with more in-depth user information. Here, we have included:
- ICR: The individual collateral ratio for the CDP in question.
- Individual Collateral and Debt: Denominated in stETH and eBTC (as well as their corresponding USD values).
- Historical data of the CDP: Historical changes to the ICR, collateral size, and debt size.
- Liquidation Price: The stETH/BTC price at which point the CDP will not have enough collateral and the system permits a liquidation.
- Gas Stipend: The fixed amount of stETH paid out to the liquidator for full liquidation.
- Events Activity Heatmap: Darker shade of purple indicates more events.

Source: Block Analitica eBTC Dashboard - Example CDP Page (CDP #1)
Wallets Section
We have also included a Wallets section with a layout similar to the CDP section. This is relevant to review when wallets are actively managing several CDPs.

Source: Block Analitica eBTC Dashboard - Wallets
Similarly to the CDP section, the Wallet section allows users to click on individual wallet rows to review more granular data.

Source: Block Analitica eBTC Dashboard - Example Wallet Page
Risk Section
The Risk section highlights some important risk-related metrics and historical data, such as:
- Total Collateral Ratio (TCR): The ratio between the value of the total collateral of the system and the total debt emitted by it.
- Critical Collateral Ratio (CCR): The collateral ratio that, if the TCR reaches, triggers Recovery Mode.
- Minimum Collateral Ratio (MCR): The lowest CR that a CDP must maintain in order to avoid triggering a liquidation under Normal Mode.
- TCR Historical Heatmap: A darker shade of green indicates a higher ratio.
- Historical Capital at Risk charts: These include collateral, per drop, and historic Capital at Risk data.
- Debt ICR Distribution: Bar chart illustrating the distribution minted eBTC at different ICRs.
- CDPs at Risk: A table with (i) collateral at risk, (ii) debt repaid, (iii) oracle price, (iv) ICRs, and (v) latest activity.

Source: Block Analitica eBTC Dashboard - Risk
CDPs at risk, at the bottom of the page, has a “View All” button, which navigates the user to another page with a complete “CDPs at Risk” table. On this page, the dashboard user can switch between liquidation simulations in both normal and recovery mode.

Source: Block Analitica eBTC Dashboard - CDPs at Risk Page
Liquidations Section
The Liquidations section contains a comprehensive overview of protocol liquidations. The page includes:
- Number of Liquidations: Displays how many liquidations have occurred in the protocol.
- Collateral Liquidated: How much stETH collateral that has been liquidated.
- Debt Repaid: How much debt that has been repaid as a result of liquidations.
- Rewards Earned: stETH amount earned through liquidations.

Source: Block Analitica eBTC Dashboard - Liquidations
Clicking on the liquidator address in the table will navigate you to the Liquidator page. This page includes in-depth information on:
- Number of Liquidations: How many liquidations the liquidator has participated in.
- Collateral Liquidated: How much collateral the liquidator has liquidated.
- Debt Repaid: How much debt has been repaid through the liquidators liquidations.
- Rewards: Rewards earned.
- Events Activity Heatmap: A darker shade of purple indicates more events.

Source: Block Analitica eBTC Dashboard - Example Liquidator Page
Activity Section
The Activity section measures and presents protocol activity-related metrics, such as (i) historical volume, (ii) historical debt, (iii) historical collateral, and (iv) a protocol activity heatmap.

Source: Block Analitica eBTC Dashboard - Activity
Clicking the “View All’’ button on the Activity page will navigate the user to a “Protocol Events” table with 1d, 7d, and 30d timeframe toggle options. Data includes:
- CDP Row: Which CDP is the event related to.
- Operations: Includes (i) deposit, (ii) sync accounting, (iii) open, (iv) close, and (v) boost.
- Collateral: The amount of collateral involved in the event.
- Debt: The amount of debt involved in the event.
- ICR: The ICR of the CDP related to the event.
- Time: At what time the event happened.

Source: Block Analitica eBTC Dashboard - Protocol Events
eBTC Section
Finally, the eBTC section includes key token details, such as:
- Total eBTC Supply: The total amount of eBTC minted.
- Number of Holders: The number of wallets holding eBTC.
- Historical Chart (Supply and Holders): Review historical changes of eBTC supply and holder data. With the option to toggle between 7d, 30d, 90d, and 1y timeframes.
- Top eBTC Holders by Share of Supply: Table of top eBTC holders by share of total eBTC supply (and corresponding USD value).
- Events Activity Heatmap: Darker shade of purple indicates more events.
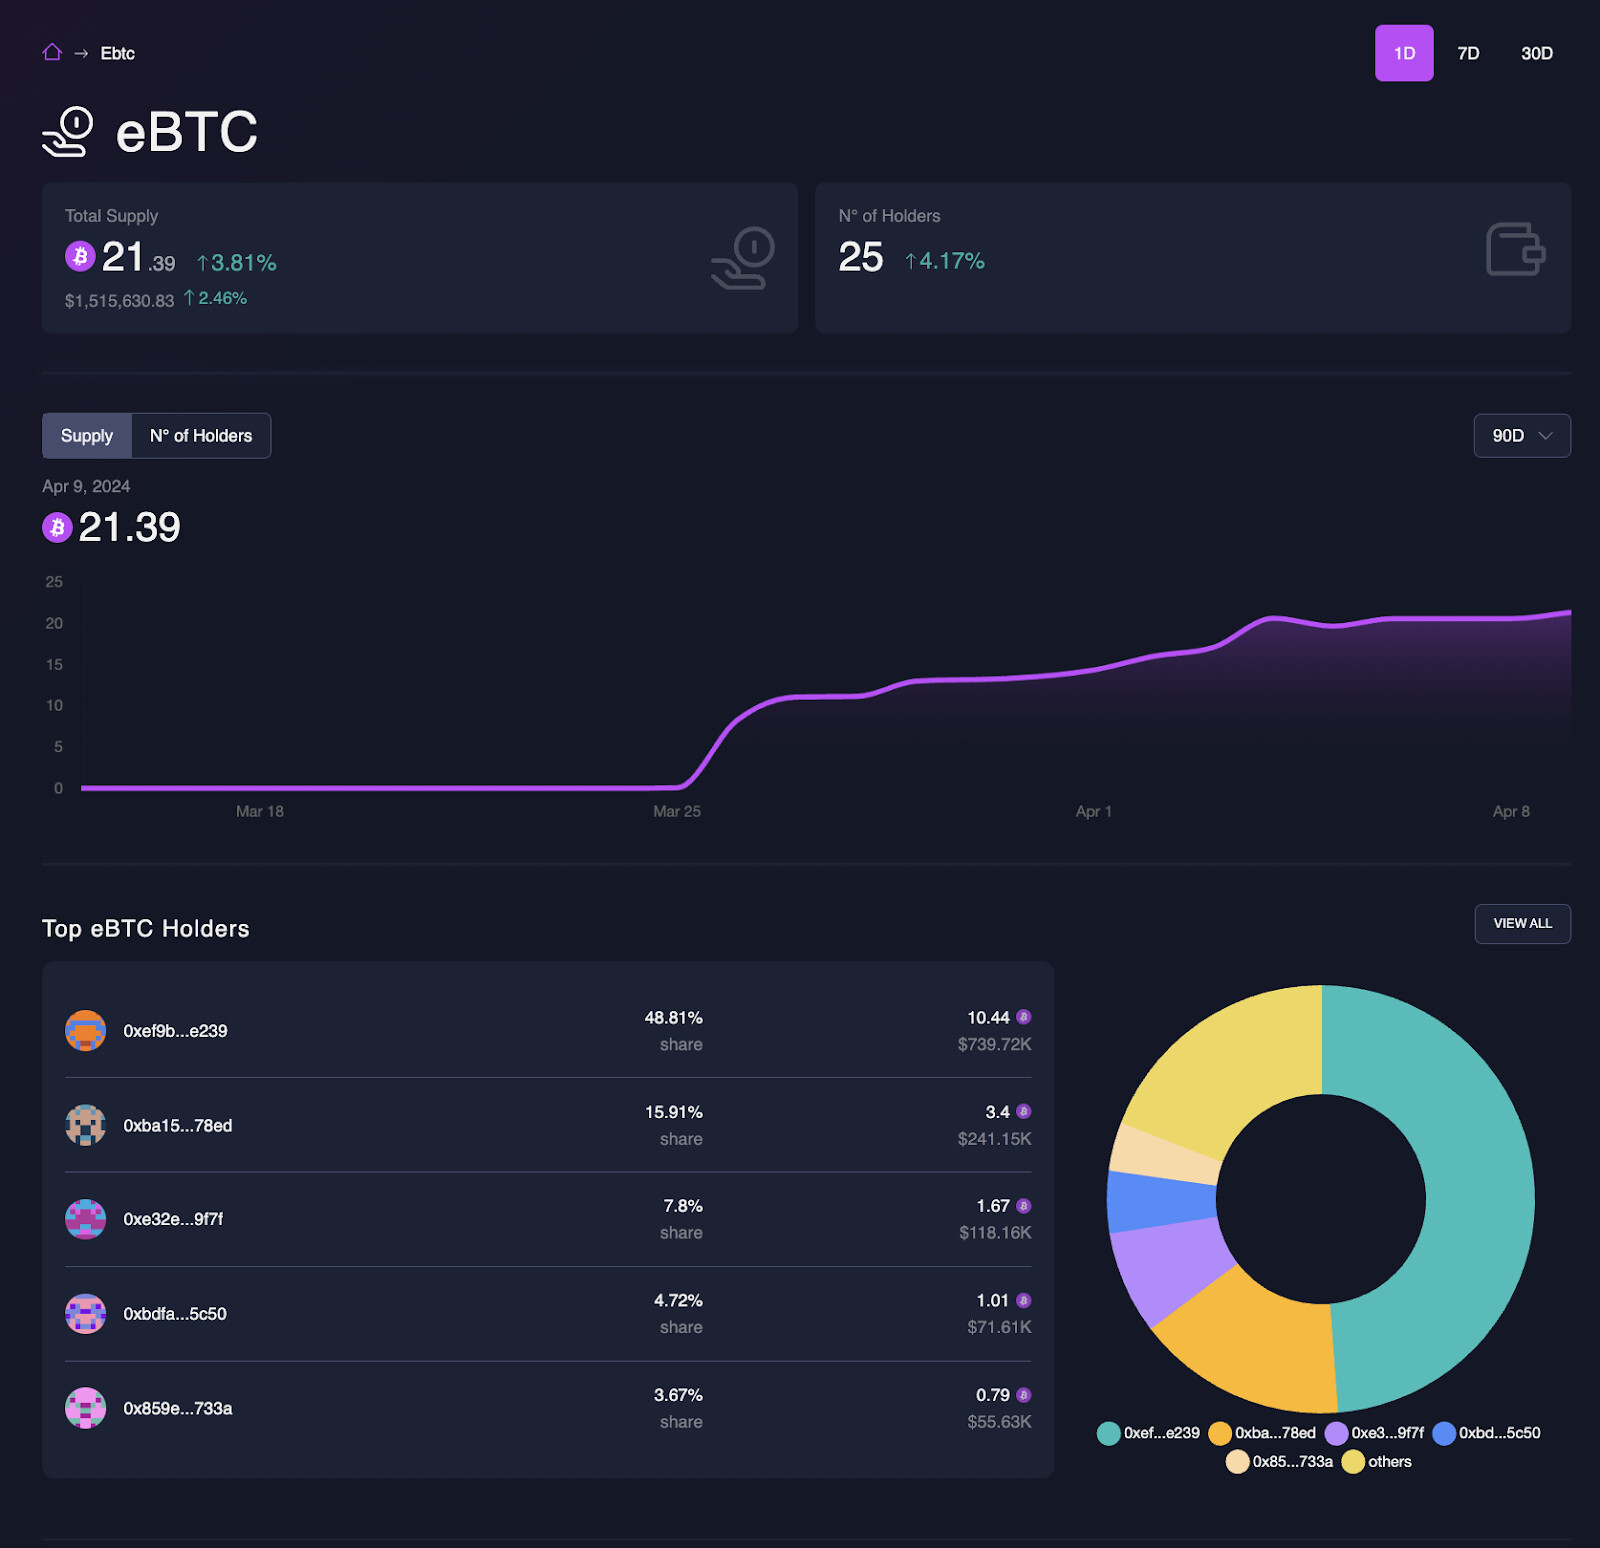
Source: Block Analitica eBTC Dashboard - eBTC Page
Similarly to the Wallet, CDP, and Liquidator sections, we have also included the option to review more granular data regarding individual holders. This data is presented in a “Holders” table, which can be accessed by clicking on the “View All’’ button on the top right corner of the doughnut chart on the eBTC page (see image below).

Source: Block Analitica eBTC Dashboard - eBTC Page
eBTC holder data can be sorted by balance, period change, and latest activity on 1d, 7d, and 30d timeframes.

Source: Block Analitica eBTC Dashboard - Holders
Clicking on a wallet row will navigate the user to a more in-depth “Holder” page with data related to individual holders.

Source: Block Analitica eBTC Dashboard - Example Holder Page
Pending Work
We soon plan on including a new Parameter section on the dashboard. The layout will be similar to the image below. The section will include:
- Parameter Values
- Parameter Min and Max Values
- Timelock
- Latest Protocol Parameter Update
- Protocol Events Table

Contact Us
If you have any feedback regarding the Block Analitica eBTC Dashboard, please comment below, or get in touch directly with @BA_Labs.
Refer to the links below to contact BA Labs Pte. Ltd (operating Block Analitica brand) and to follow our work:
- Twitter: @BlockAnalitica
- Website: https://blockanalitica.com/
- Email: info@ba-labs.co